Console Logs in Elsa 3.8: Raw Stream Diagnostics
By Sipke Schoorstra · 2026-06-03
Elsa 3.8 console logs capture raw stdout and stderr with recent history, live streaming, ANSI handling, dropped-line reporting, and workflow context.
Elsa 3.8 preview 1 adds Elsa.Diagnostics.ConsoleLogs, an opt-in diagnostics module for raw stdout and stderr output. It uses the Console Log Streaming library as the capture foundation and layers Elsa workflow context on top (Console Log Streaming, retrieved 2026-06-30).
That makes this feature intentionally different from structured logs. Structured logs answer "what semantic event did the application report?" Console logs answer "what did this process print?"
Key Takeaways
- Elsa 3.8 console logs preserve stdout and stderr as distinct streams.
- The backend exposes recent lines, sources, and a SignalR hub for live updates.
- Bounded buffers, maximum line length, ANSI handling, and dropped-line summaries keep the raw stream honest.
In our experience, console output is often the first useful clue during workflow development. It is also one of the easiest signals to lose once the process runs somewhere other than your terminal.
What are console logs in Elsa?
Console logs are raw process output captured from stdout and stderr. In Elsa 3.8, the module records completed lines, keeps stdout and stderr distinct, applies redaction, attaches source and workflow metadata where available, stores recent bounded history, and streams live updates to Studio.
The standalone capture library has tests for the core behavior: a write to stdout remains stdout, a write to stderr remains stderr, and sensitive text such as password=secret or token=abc123 is redacted before it appears in recent results.
That is the right boundary. Console output is not a logging schema. It is the raw stream. The module should preserve enough of the stream to make it useful without pretending it can infer the same semantics as an ILogger event.
When should you use console logs?
Use console logs when the diagnostic question depends on printed output. In practice, that usually means scripts, external tools, quick Console.WriteLine instrumentation, AI or agent progress output, or libraries that write directly to stdout or stderr.
| Situation | Better surface |
|---|---|
An activity wrote progress text with Console.WriteLine |
Console logs |
| A tool wrote errors to stderr | Console logs |
| You need level, category, scope, and exception fields | Structured logs |
| You need traces, metrics, resources, or OTLP logs | OpenTelemetry diagnostics |
| You need long retention, alerting, or cross-environment search | External observability stack |
That table is the main design point. The console log viewer should not become a logging platform, and structured logs should not have to swallow raw terminal output.
How does Studio show the raw stream?
Studio adds the console diagnostics page at /diagnostics/console. The page loads recent console lines, subscribes to live updates, and supports filters for source, stream, text, time range, and workflow context.
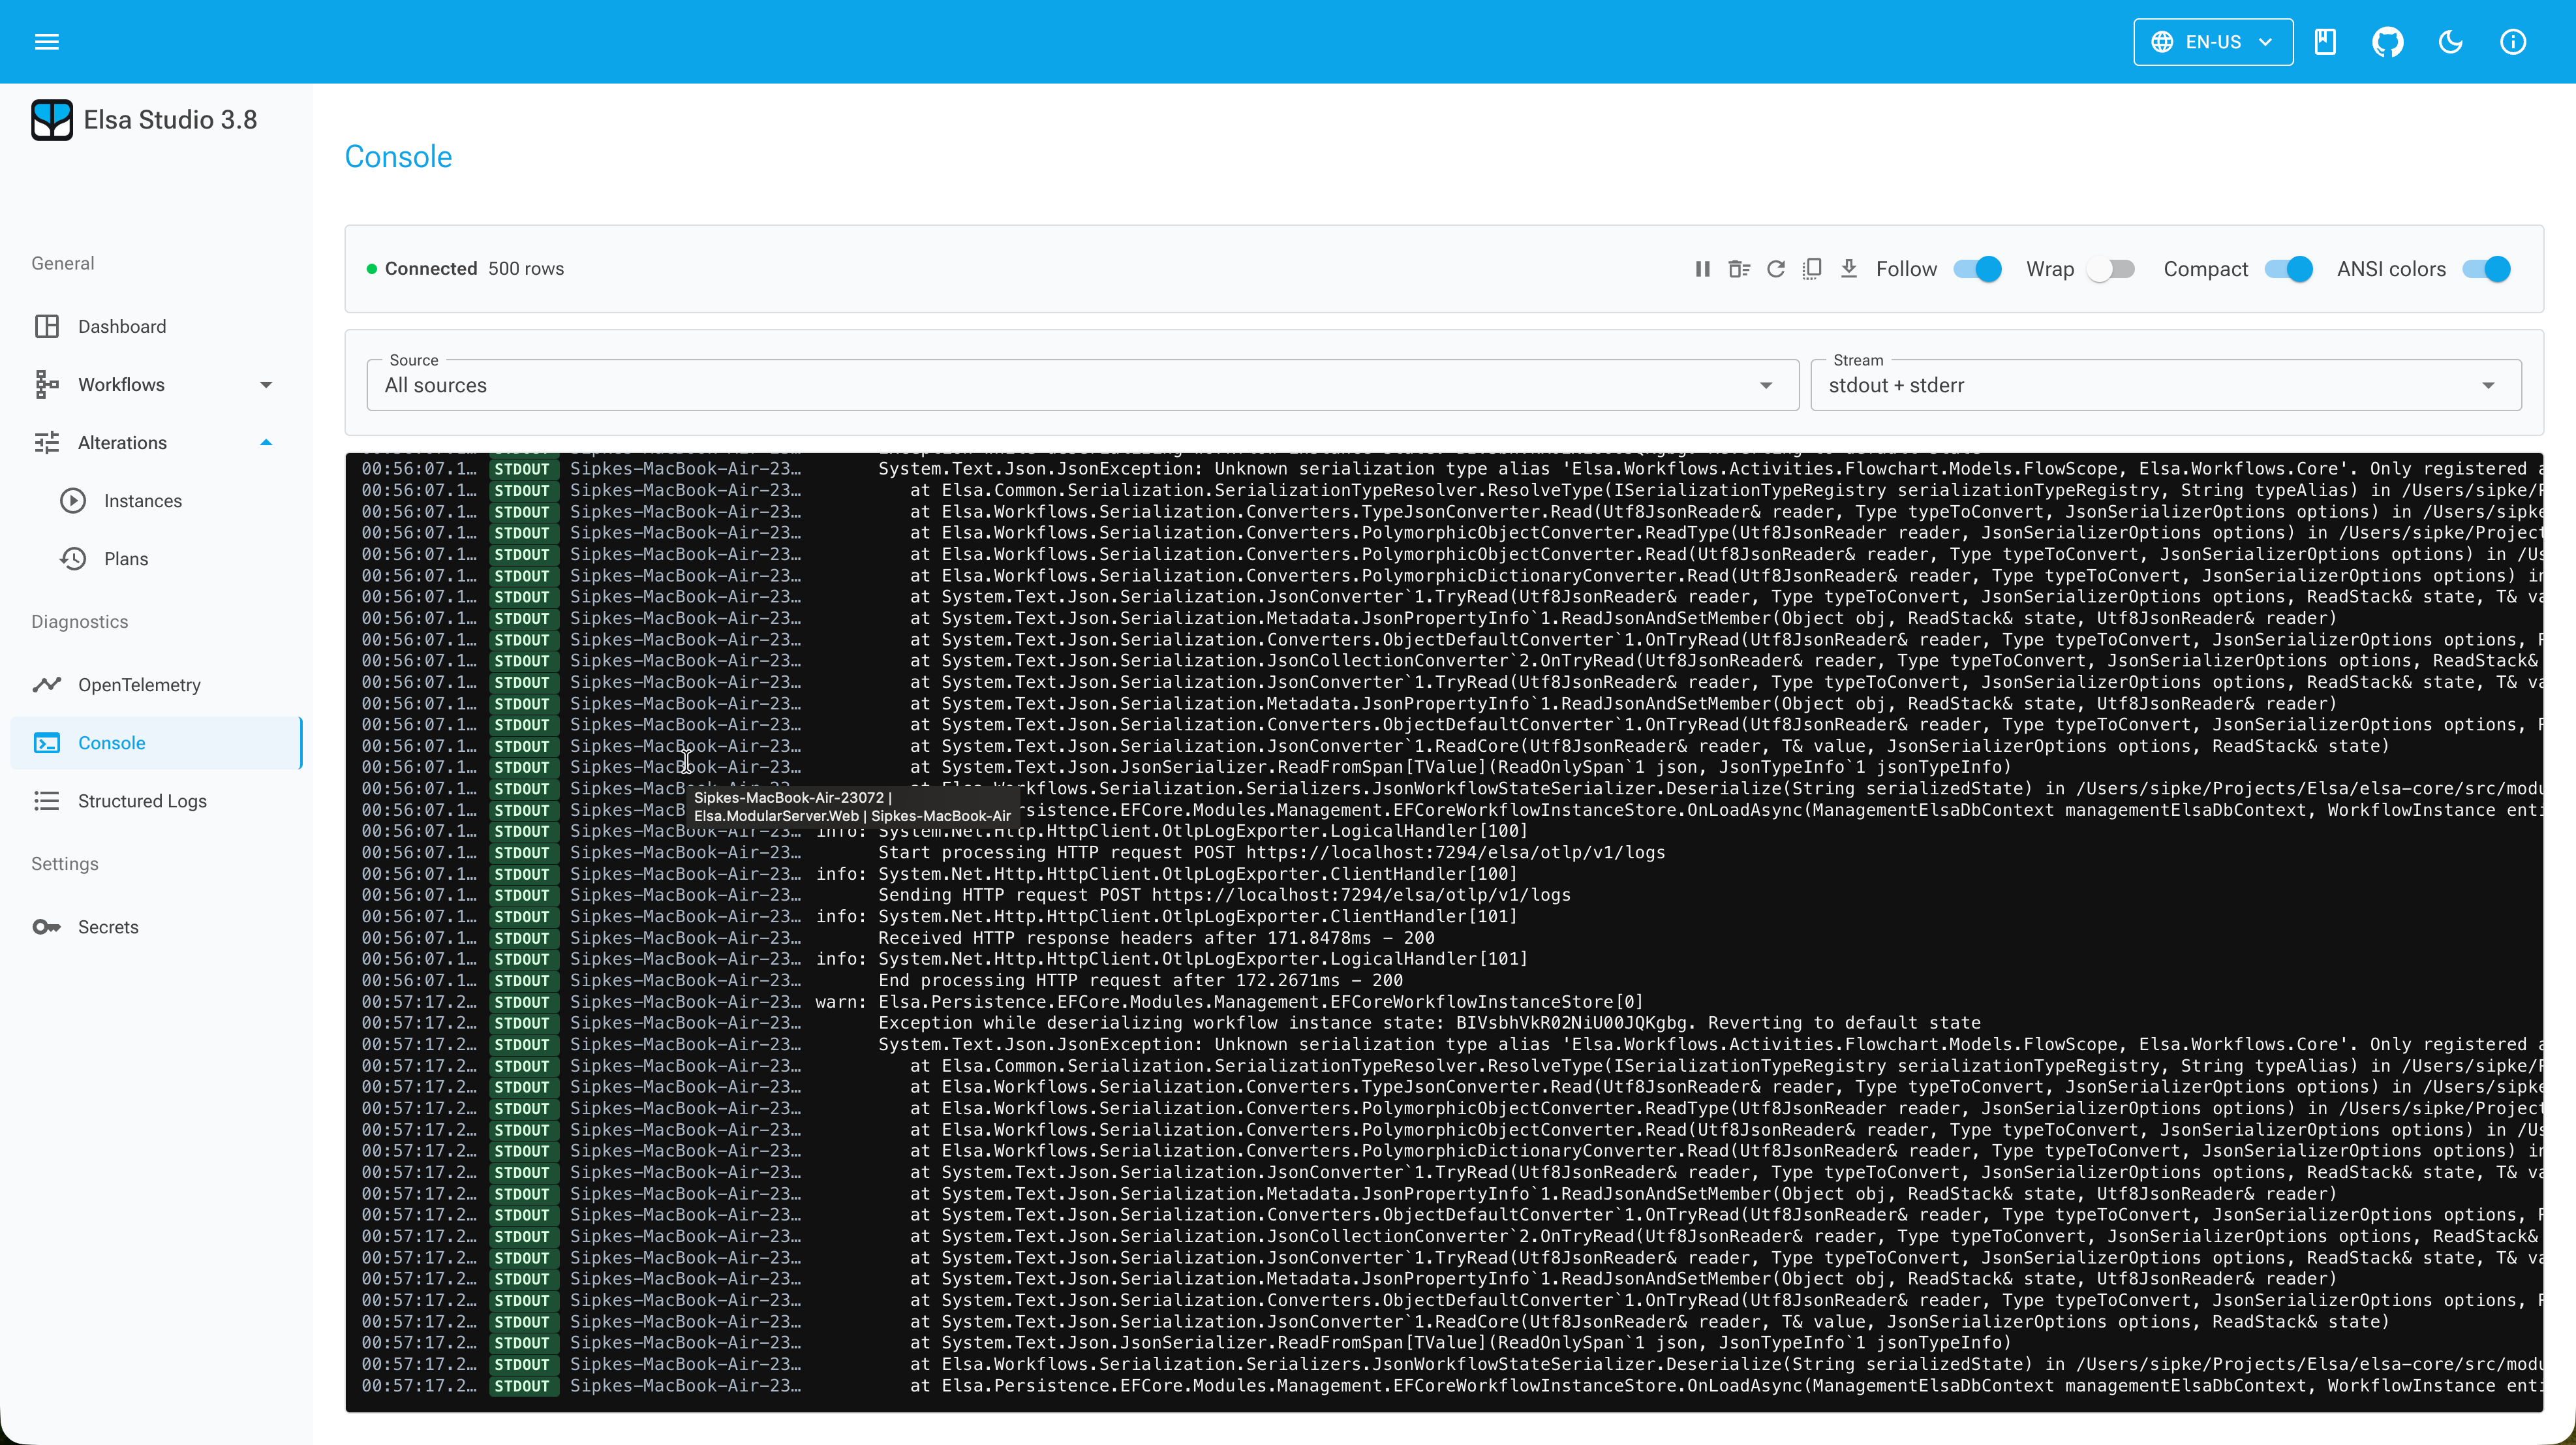
The Studio module also contributes workflow instance console-log widgets. That matters because the most useful place for raw output is often the workflow instance screen, not a generic diagnostics page.
For example, a workflow might call a CLI tool, stream progress from an AI agent, or print checkpoint messages during local development. If you are already inspecting the workflow instance, the related console output should be close by.
Studio preserves workflow scoping in its live subscription model. The tests cover mapping a workflow-instance-a filter into the live subscription request, so the instance tab can stay scoped instead of becoming a global tail.
What does the backend expose?
Core exposes two read route fragments under the configured Elsa API prefix:
POST /diagnostics/console-logs/recent
GET  /diagnostics/console-logs/sources
Live updates use the diagnostics hub:
/elsa/hubs/diagnostics/console-logs
The route is covered by a naming test, and the read surface requires the console logs diagnostics permission:
read:diagnostics:console-logs
That permission matters. Raw console output can contain operational details, customer identifiers, stack traces, and accidental secrets. It should be treated as runtime diagnostics, not as harmless UI text.
Why are the buffers bounded?
Console logs are bounded because raw output can be noisy. A tight loop can print thousands of lines. An external tool can write a large stderr burst. A browser tab can lag behind the backend stream.
Elsa makes those constraints explicit:
services.AddElsa(elsa =>
{
    elsa.UseConsoleLogs(options =>
    {
        options.RecentCapacity = 5_000;
        options.SubscriberCapacity = 1_000;
        options.MaxRecentQuerySize = 1_000;
        options.MaxLineLength = 16_384;
        options.PreserveAnsi = true;
    });
});

app.UseConsoleLogs();
Those defaults communicate the operational model. Recent history is capped. Subscriber queues are capped. Queries are capped. Individual lines have a maximum length.
When lines are dropped, the hub can send ReceiveDroppedLinesAsync summaries to clients. That is better than a silent gap. During an incident, "the stream dropped lines" is information the operator needs to see.
How does ANSI handling work?
ANSI handling is explicit because terminal output uses color and control sequences for meaning. The standalone library strips ANSI by default in its core capture tests: \u001b[31mred\u001b[0m becomes red when preservation is not enabled.
Elsa exposes PreserveAnsi so a host can keep ANSI sequences when that output is useful. Studio can then render or strip ANSI depending on viewer behavior.
This sounds minor until you inspect real command-line output. Colors often separate warnings from errors, progress from final output, or sections from details. Keeping the decision explicit avoids two bad defaults: destroying useful formatting or blindly rendering every control sequence.
What should teams watch for?
Teams should treat console logs as short-lived operational diagnostics. They are excellent for local development, support sessions, external process output, AI or agent progress, and "what did the server just print?" questions.
They are weaker for durable audit trails, compliance, historical search, or analytics. For those jobs, route logs and telemetry into your normal observability stack.
The useful pattern is to keep the three Elsa diagnostics surfaces separate:
- Console logs for raw stdout and stderr.
- Structured logs for semantic
ILoggerevents with workflow context. - OpenTelemetry diagnostics for resources, traces, metrics, and OTLP logs.
Elsa 3.8 preview 1 is moving toward a more honest operations model. It does not pretend raw console output is enough. It does make that output available in Studio when the raw stream is exactly what you need.