Elsa 3.8 Preview 1: Operational Visibility
By Sipke Schoorstra · 2026-06-01
Elsa 3.8.0 preview 1 adds five operator-facing areas: structured logs, console logs, OpenTelemetry diagnostics, secrets, and alterations.
Elsa 3.8.0 preview 1 is best read as an operations release. The Core and Studio release notes list many changes, but five areas form the center of gravity: structured logs, console logs, OpenTelemetry diagnostics, secrets, and workflow alterations (elsa-core 3.8.0-preview1, 2026; elsa-studio 3.8.0-preview1, 2026).
That matters because workflow systems fail in operationally specific ways. A workflow can be waiting on the wrong activity. A credential can be copied into the wrong place. A container can drop log lines under pressure. A support engineer can need the raw console output and the semantic application log for the same workflow instance.
Key Takeaways
- Elsa 3.8.0 preview 1 adds five operator-facing surfaces across Core and Studio.
- The diagnostics work separates structured logs, console logs, and OpenTelemetry instead of flattening them into one table.
- Secrets and alterations move two common production concerns into explicit Elsa product models.
In our experience, this is the work that makes a workflow runtime easier to run after the first demo. It is less flashy than a new activity, but it reduces the number of moments where the only answer is "restart the host and inspect the database by hand."
The deeper feature posts are here:
- Structured Logs in Elsa 3.8
- Console Logs in Elsa 3.8
- OpenTelemetry Diagnostics in Elsa 3.8
- Secret References in Elsa 3.8
- Workflow Alterations in Elsa 3.8
A later 3.8-line follow-up explains how Elsa StateMachine transitions run and how Studio exposes them. That work merged after Preview 1.
What changed in Elsa 3.8 preview 1?
Elsa 3.8 preview 1 adds five operational feature areas across elsa-core and elsa-studio: structured logs, console logs, OpenTelemetry diagnostics, secrets, and alterations (Core release notes, 2026; Studio release notes, 2026). The common theme is not "more screens." It is clearer runtime state and safer operator actions.
At a high level, the preview gives operators separate answers to separate questions:
| Operator question | Elsa 3.8 preview 1 area | Primary shape |
|---|---|---|
| What did the application log with workflow context? | Structured logs | Queryable ILogger events |
| What did the process write to stdout or stderr? | Console logs | Raw bounded line stream |
| What telemetry came through OTLP? | OpenTelemetry diagnostics | Resources, traces, metrics, and logs |
| How should a workflow refer to a credential? | Secrets | Named secret references and runtime resolution |
| How can an operator correct a running instance? | Alterations | Staged operational changes |
Those boundaries are useful. A semantic log event, an ANSI console line, an OTLP span, and a secret reference are not the same kind of thing. Keeping them separate makes each one easier to reason about.
How do structured logs help operators?
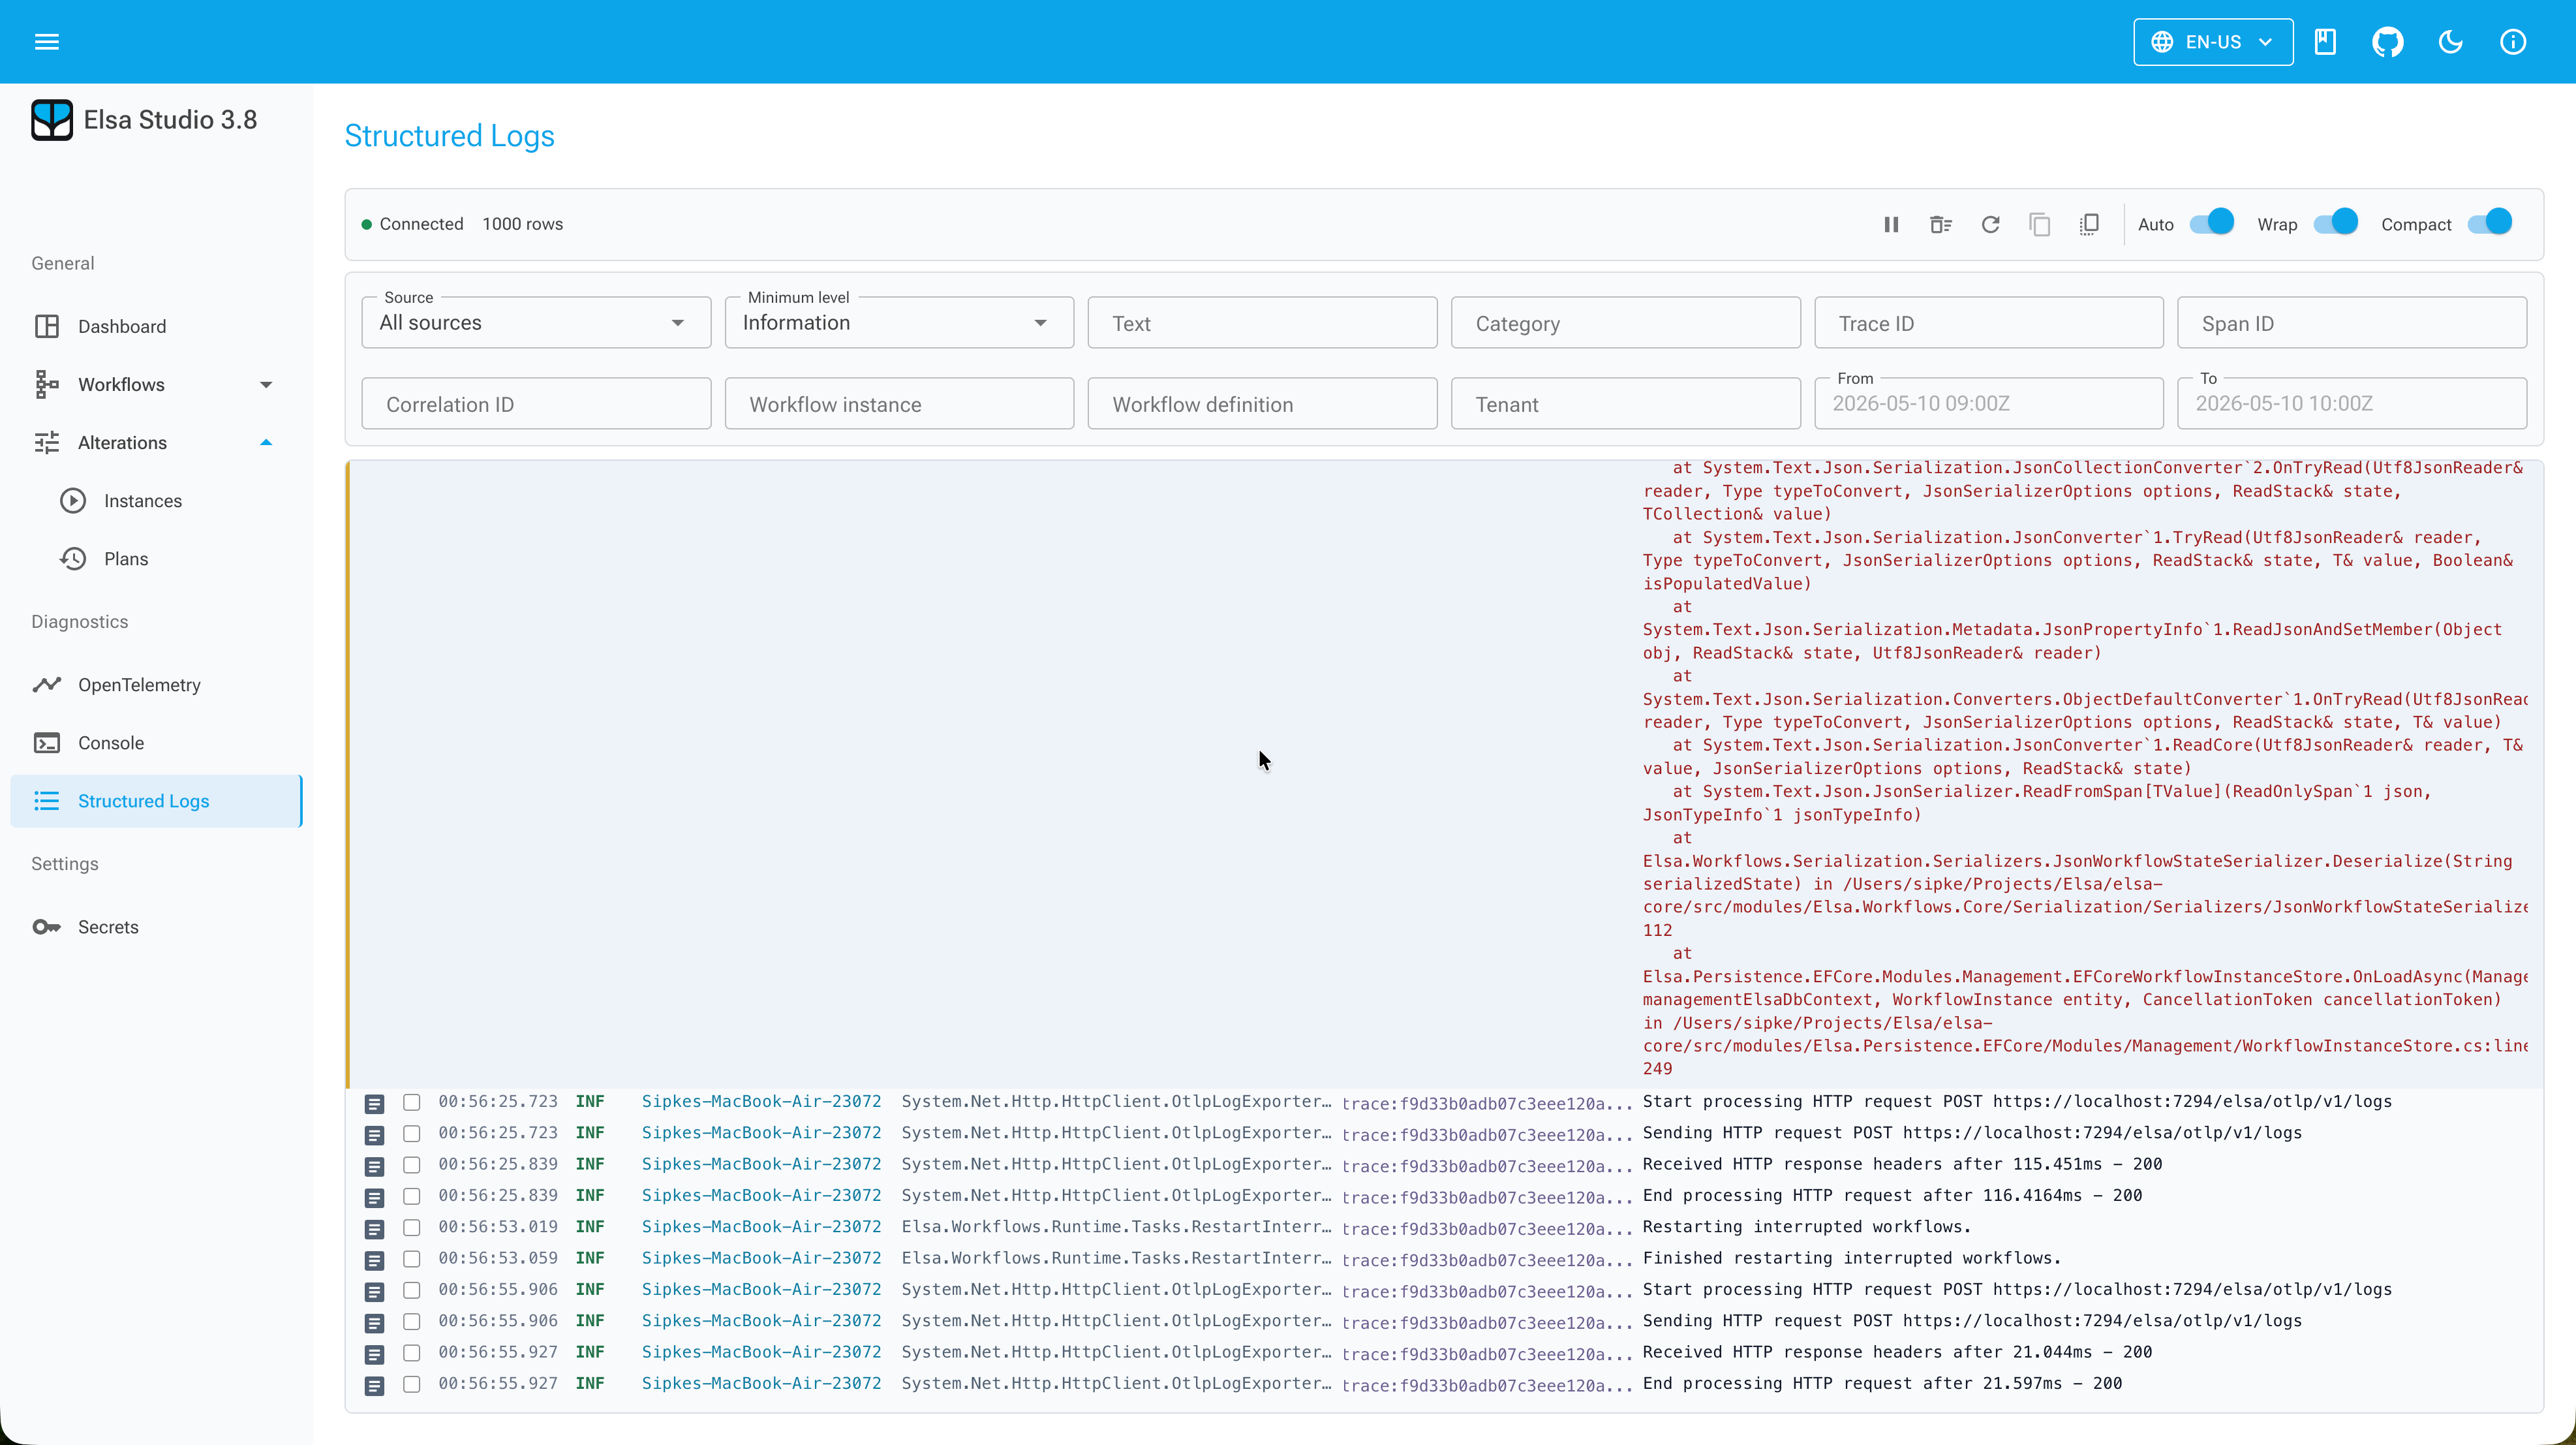
Structured logs add a dedicated diagnostics surface for semantic ILogger events. The Core module exposes recent logs, sources, storage diagnostics, and a SignalR stream, while Studio renders the page at /diagnostics/structured-logs (Core release notes, 2026).
The important distinction is that structured logs are records, not lines of text. They can carry level, category, message template, rendered message, properties, scopes, exception details, tenant, workflow context, correlation IDs, trace IDs, span IDs, and source metadata.
That gives an operator better questions to ask. "Show me errors for this workflow instance" is different from "grep the container output and hope the line was still in the buffer." Studio can filter by level, category, message, tenant, workflow instance, source, trace ID, and span ID.
Configuration stays close to the existing Elsa module style:
services.AddElsa(elsa =>
{
    elsa.UseStructuredLogs(options =>
    {
        options.RecentLogCapacity = 5_000;
        options.MaxRecentLogQuerySize = 1_000;
        options.SourceHeartbeatTimeout = TimeSpan.FromSeconds(30);
    });
});

app.UseStructuredLogs();
The default store is in memory, which is enough for local development and short-lived operational inspection. The module is storage-provider neutral, and the preview includes SQLite structured log persistence through Elsa.Diagnostics.StructuredLogs.Persistence.Sqlite.
The detail I like here is source awareness. In a containerized environment, "the server" may mean a pod, namespace, container, node, machine name, process ID, or some combination of them. Structured logs preserve that source shape so Studio does not collapse distributed runtime state into one anonymous stream.
Why are console logs separate from structured logs?
Console logs cover a second diagnostics path: raw stdout and stderr. The Core module maps recent lines, sources, and a live hub, while Studio exposes the operator page at /diagnostics/console (Console Logs in Elsa 3.8, 2026).
That separation is deliberate. Structured logs are queryable application events. Console logs are raw process output. Sometimes the fastest question is simply, "what did this process just print?"
services.AddElsa(elsa =>
{
    elsa.UseConsoleLogs(options =>
    {
        options.RecentCapacity = 5_000;
        options.SubscriberCapacity = 1_000;
        options.MaxRecentQuerySize = 1_000;
        options.MaxLineLength = 16_384;
        options.PreserveAnsi = true;
    });
});

app.UseConsoleLogs();
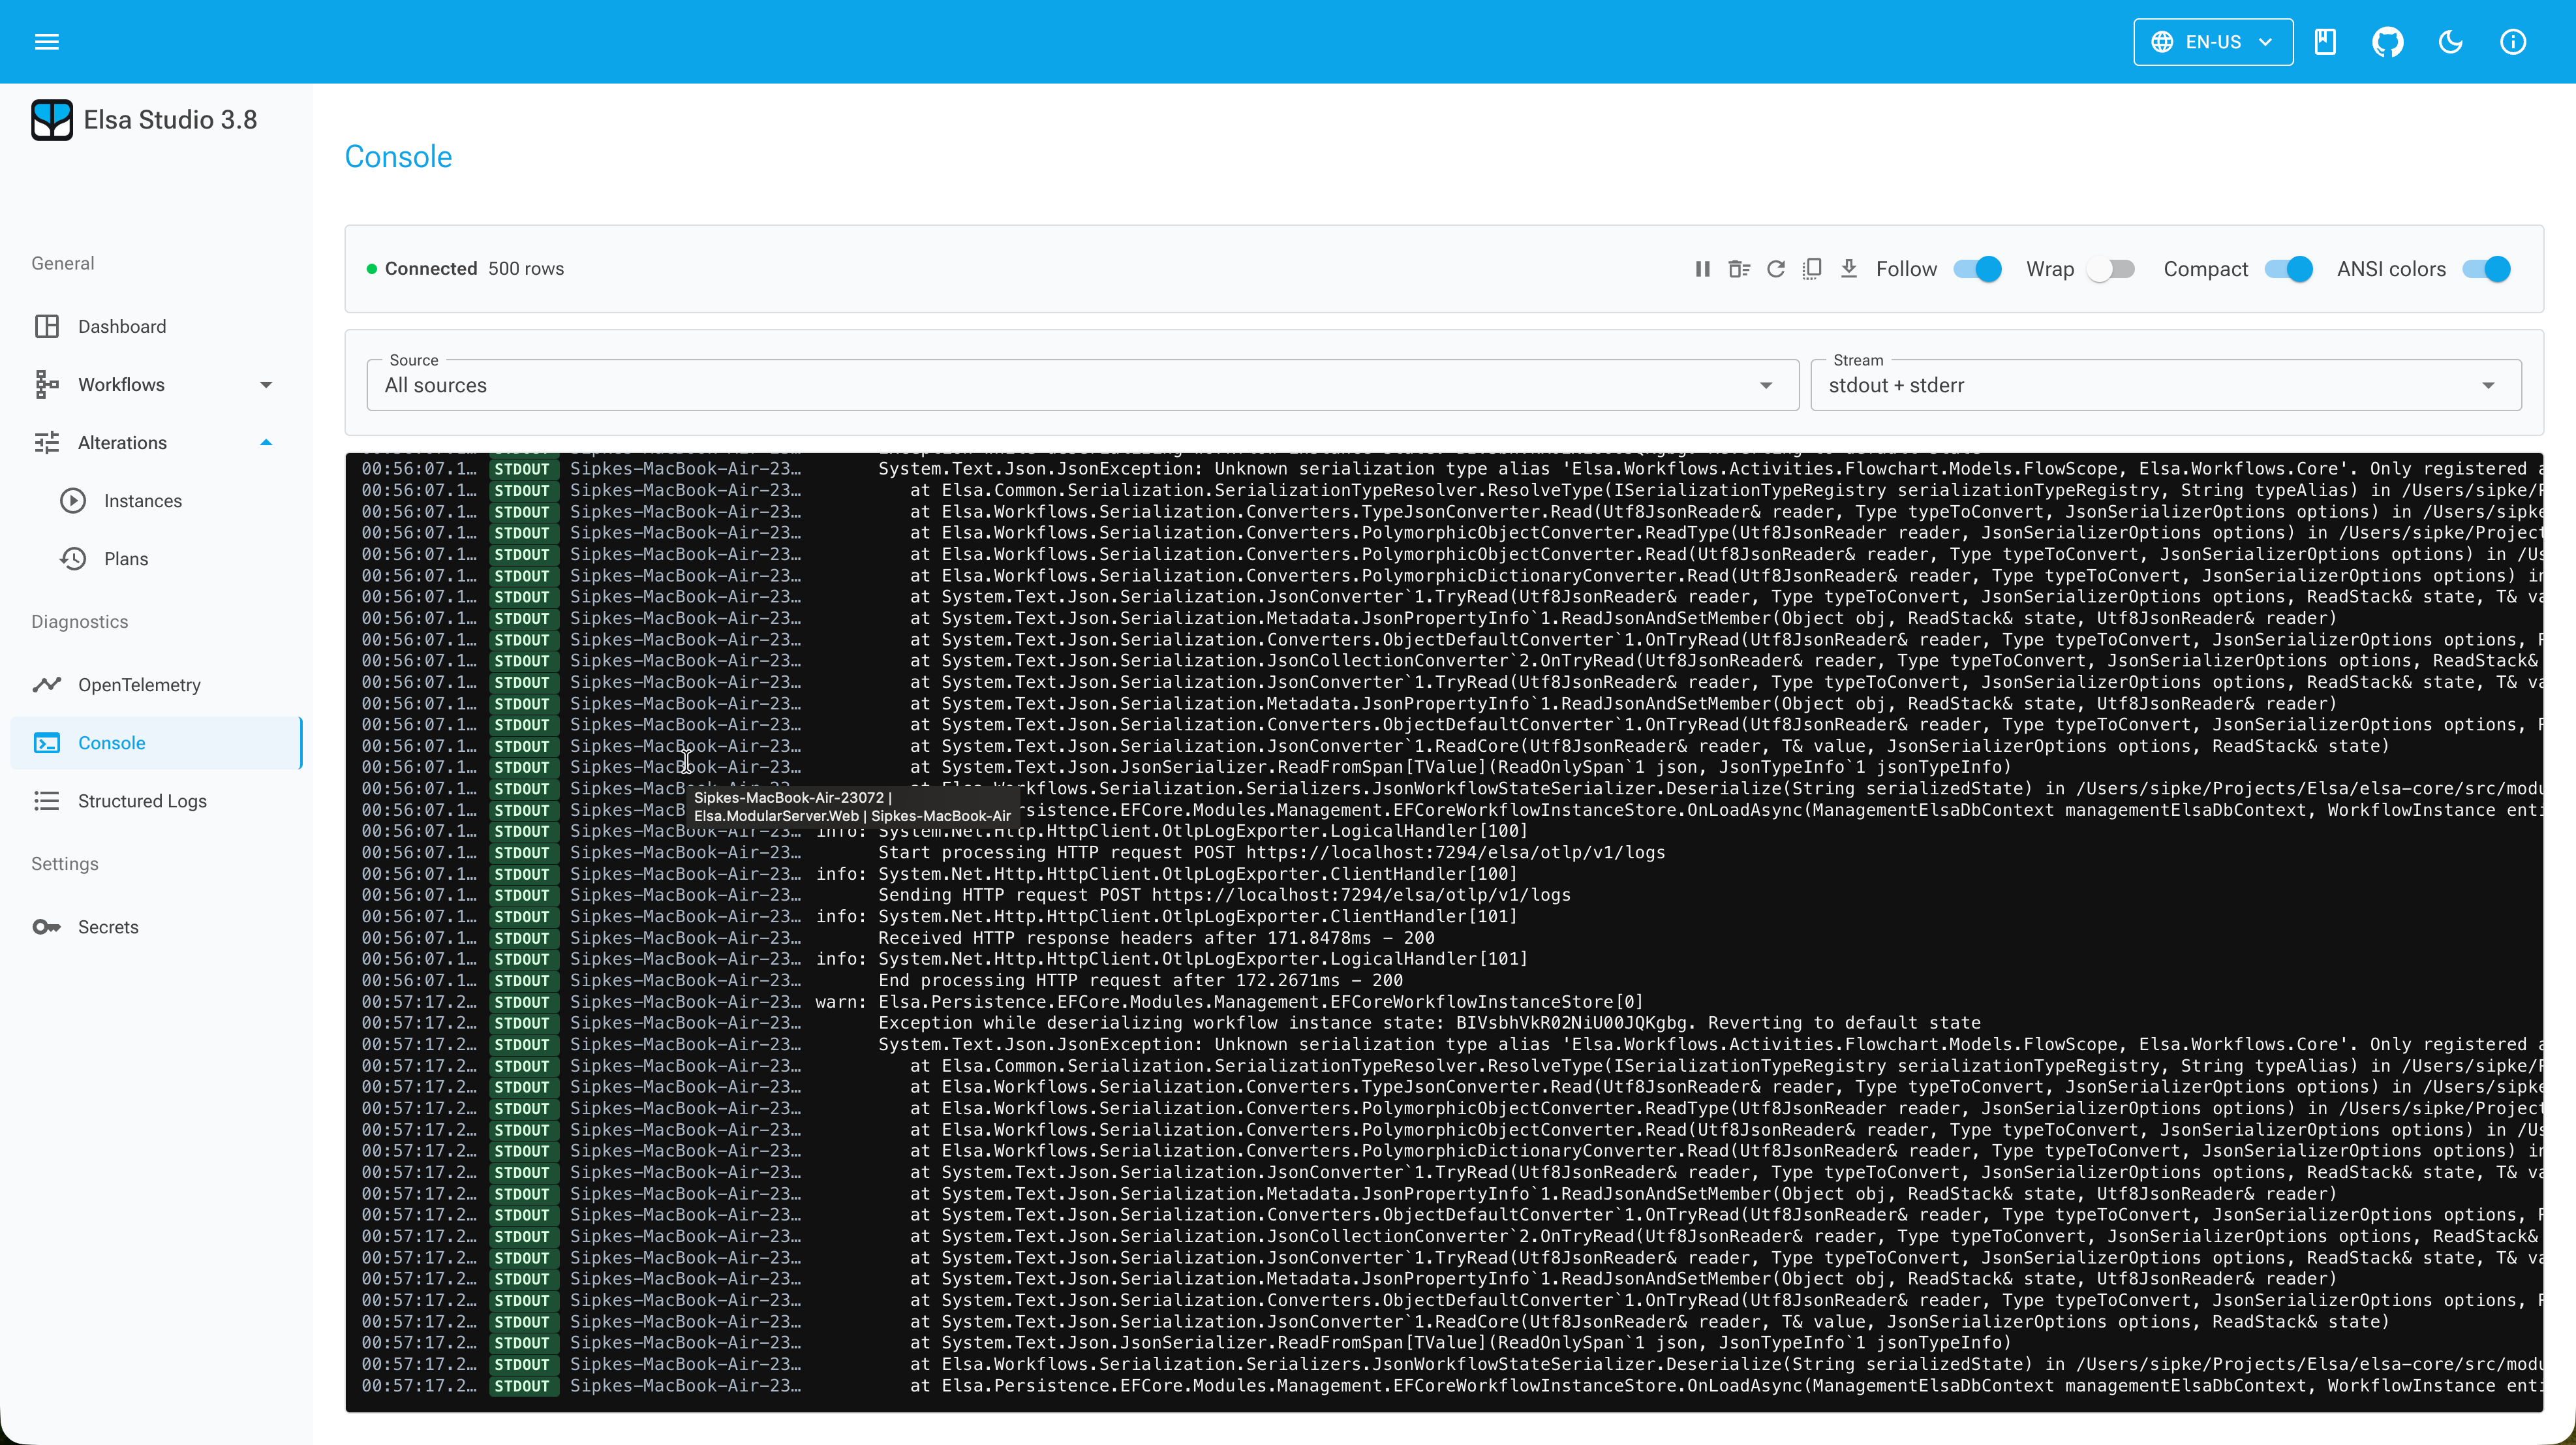
In practice, I expect console logs to be most useful during development, support sessions, and incident triage where an activity, script, external tool, or library wrote directly to stdout or stderr. The module keeps recent bounded history and reports dropped-line summaries when buffers overflow, which is the right failure mode for a preview diagnostics stream.
It is not a durable logging backend. That is fine. The product value is that Elsa can show raw process output in Studio without pretending those lines are the same thing as structured application events.
What does OpenTelemetry diagnostics add?
OpenTelemetry diagnostics add a third diagnostics surface. Core receives and normalizes recent OTLP telemetry, including resources, traces, metrics, and logs; Studio reads those normalized APIs at /diagnostics/opentelemetry (OpenTelemetry Diagnostics in Elsa 3.8, 2026).
The split matters. Core owns ingestion, storage pressure, redaction, permissions, and DTO contracts. Studio renders the read model. Studio does not parse OTLP protobuf payloads or become the telemetry collector.
The default OTLP HTTP base path is:
/elsa/otlp/v1
with the signal-specific endpoints below it:
POST /elsa/otlp/v1/traces
POST /elsa/otlp/v1/metrics
POST /elsa/otlp/v1/logs
The Studio-facing diagnostics API then uses routes such as:
/diagnostics/opentelemetry/resources/search
/diagnostics/opentelemetry/traces/search
/diagnostics/opentelemetry/metrics/search
/diagnostics/opentelemetry/logs/search
/diagnostics/opentelemetry/storage
/diagnostics/opentelemetry/collector-configuration
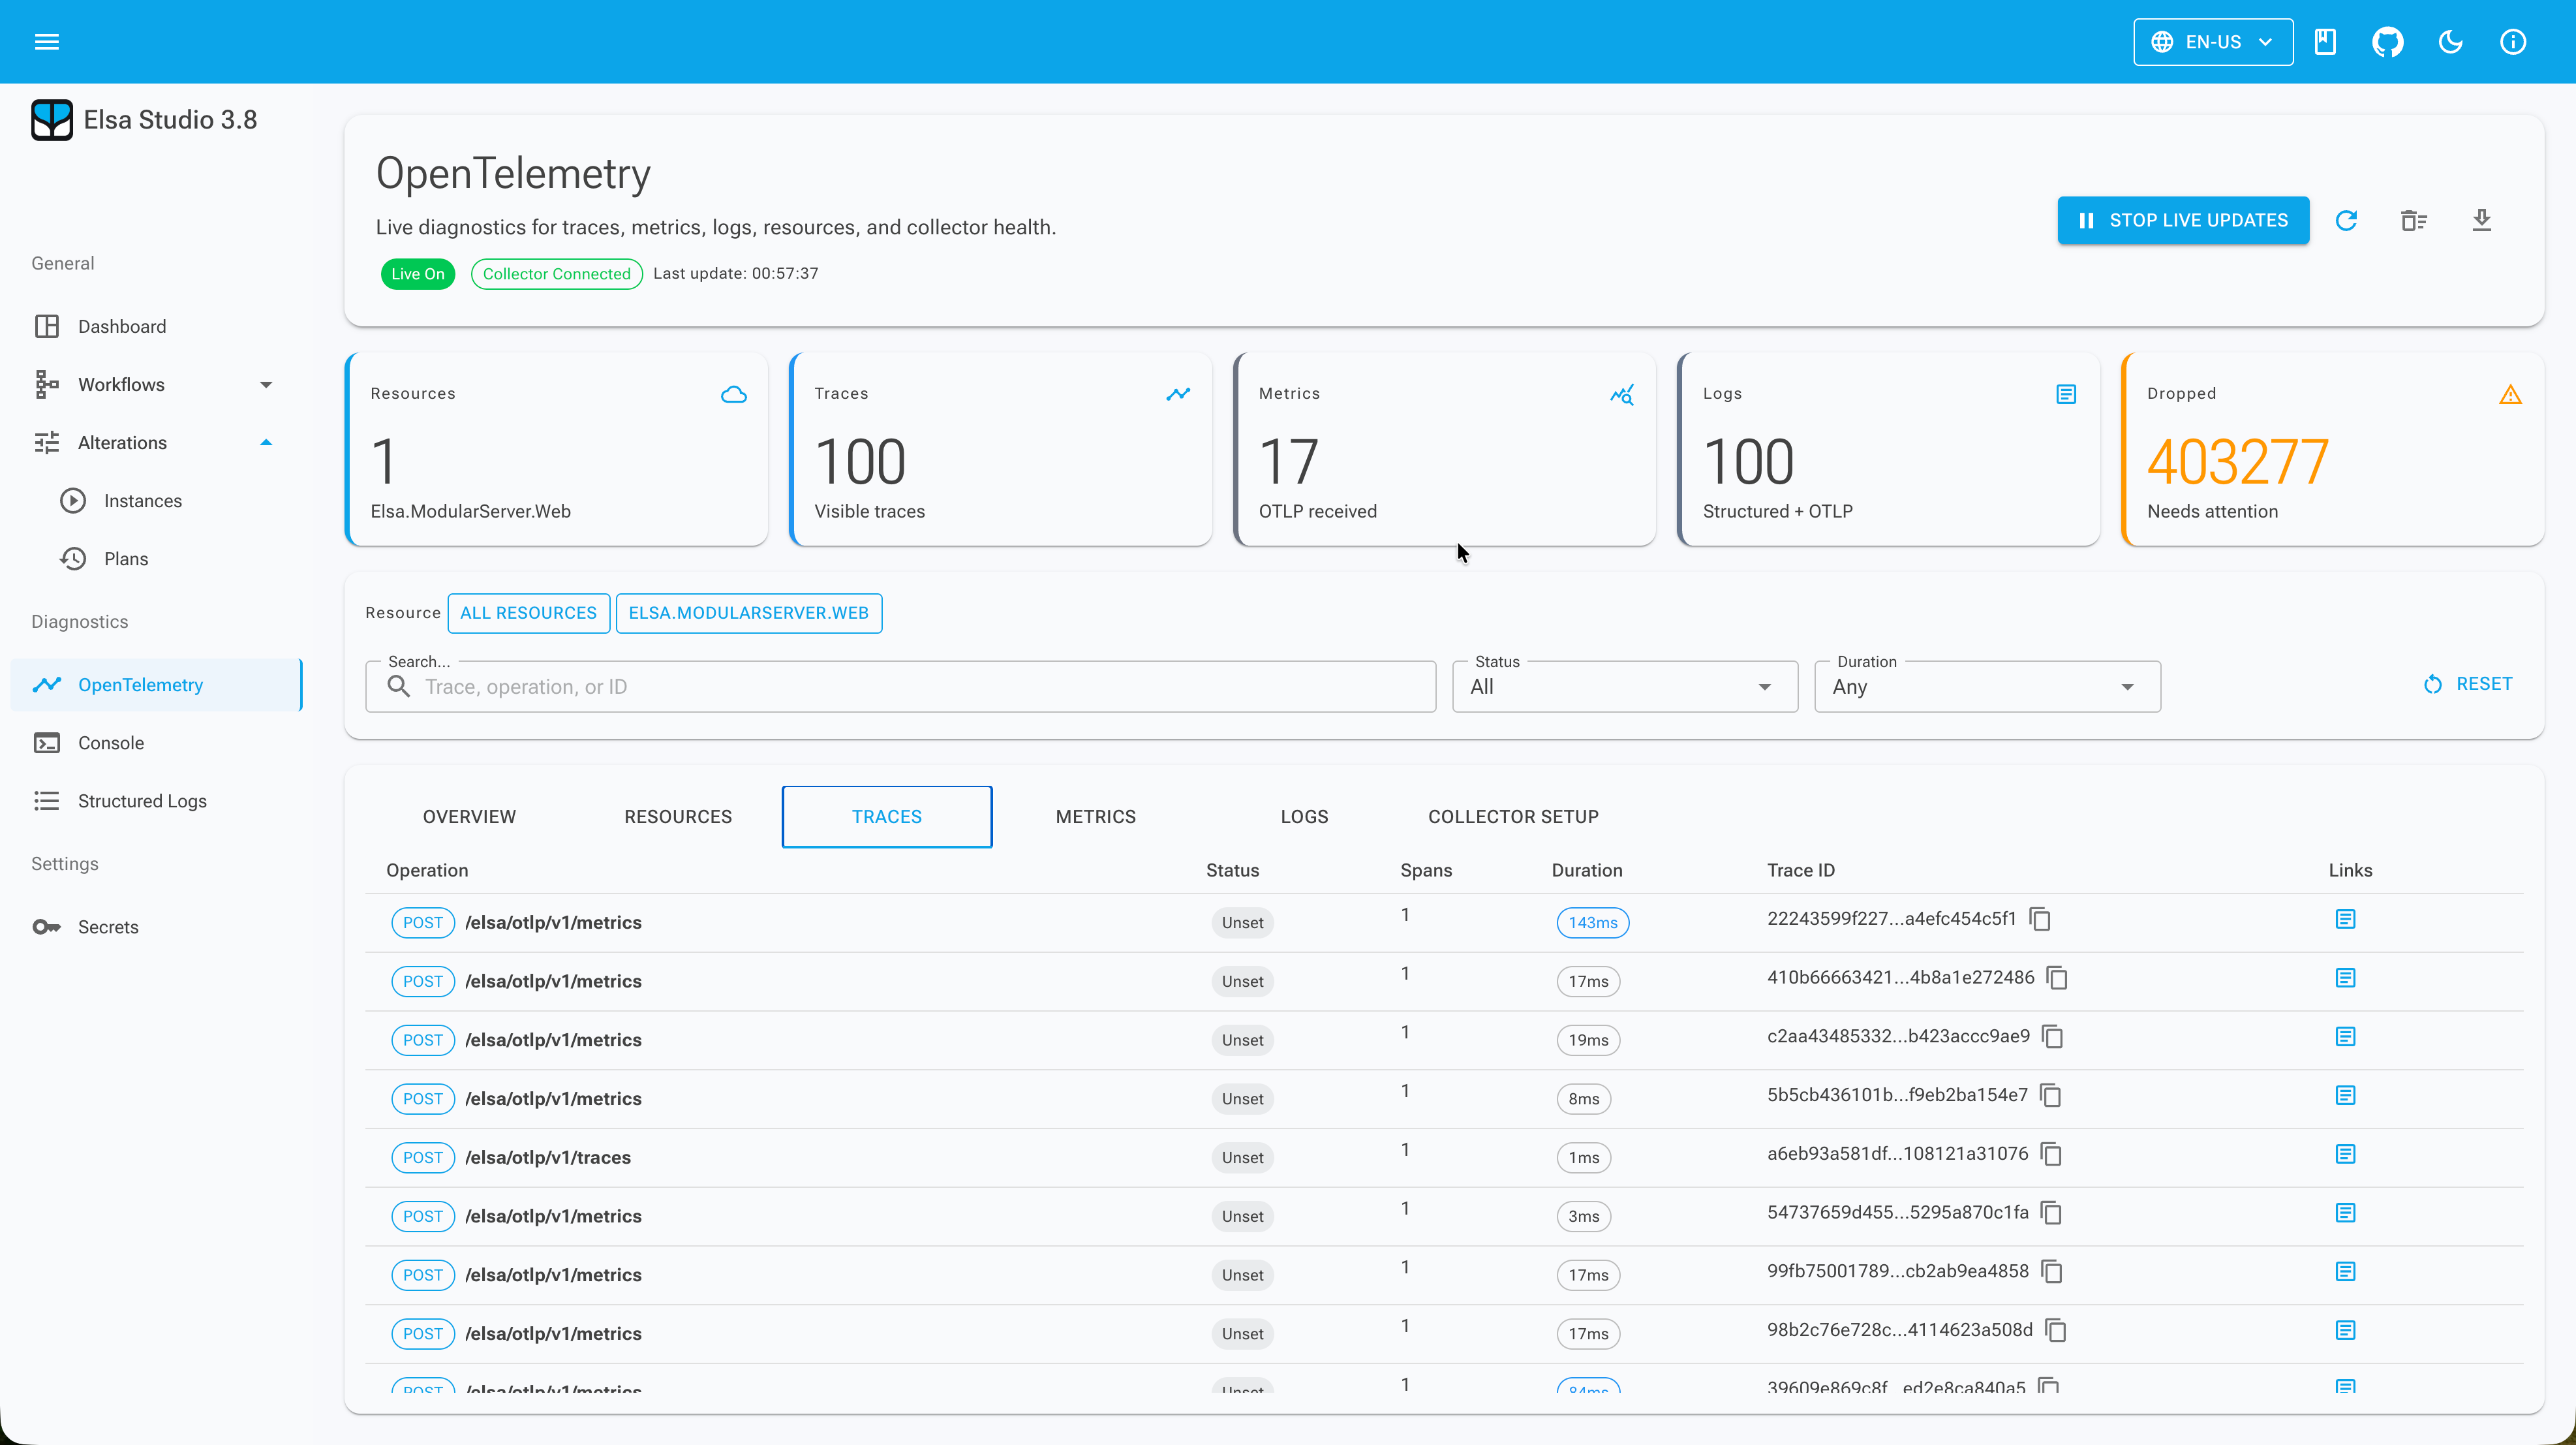
The viewer includes a resource picker, trace waterfall, metric series table, span details, live update controls, export action, filters, and storage overflow state. It also links naturally to the structured and console log surfaces through trace, span, resource, and time-window values.
This is not meant to replace a production observability platform. If you already export telemetry to an OpenTelemetry Collector, vendor backend, or long-retention store, keep doing that. Elsa's built-in diagnostics view is for recent workflow-relevant telemetry close to the runtime.
What changes with secrets?
Secrets move credential references into the Elsa product model. The preview adds Elsa.Secrets in Core, a Studio page under /security/secrets, a Secret expression type, and JavaScript getSecret(name) support through Elsa.Secrets.JavaScript (Secret References in Elsa 3.8, 2026).
That is a practical shift. Without a first-party model, teams tend to improvise: environment variables here, copied workflow inputs there, and activity fields that look like ordinary strings even when they contain credentials.
The Core model is more than a name/value bag. A secret has a name, display name, description, type, store, optional scope, tags, status, current version, timestamps, and expiration. The API supports create, list, get, update, rotate, revoke, delete, test, picker, type descriptor, and store descriptor operations.
Studio adds search, creation, detail, rotation, test, revoke, and delete flows. More importantly, it adds a picker pattern for inputs that can contain secrets. A workflow input can hold a Secret expression reference rather than the secret value itself.
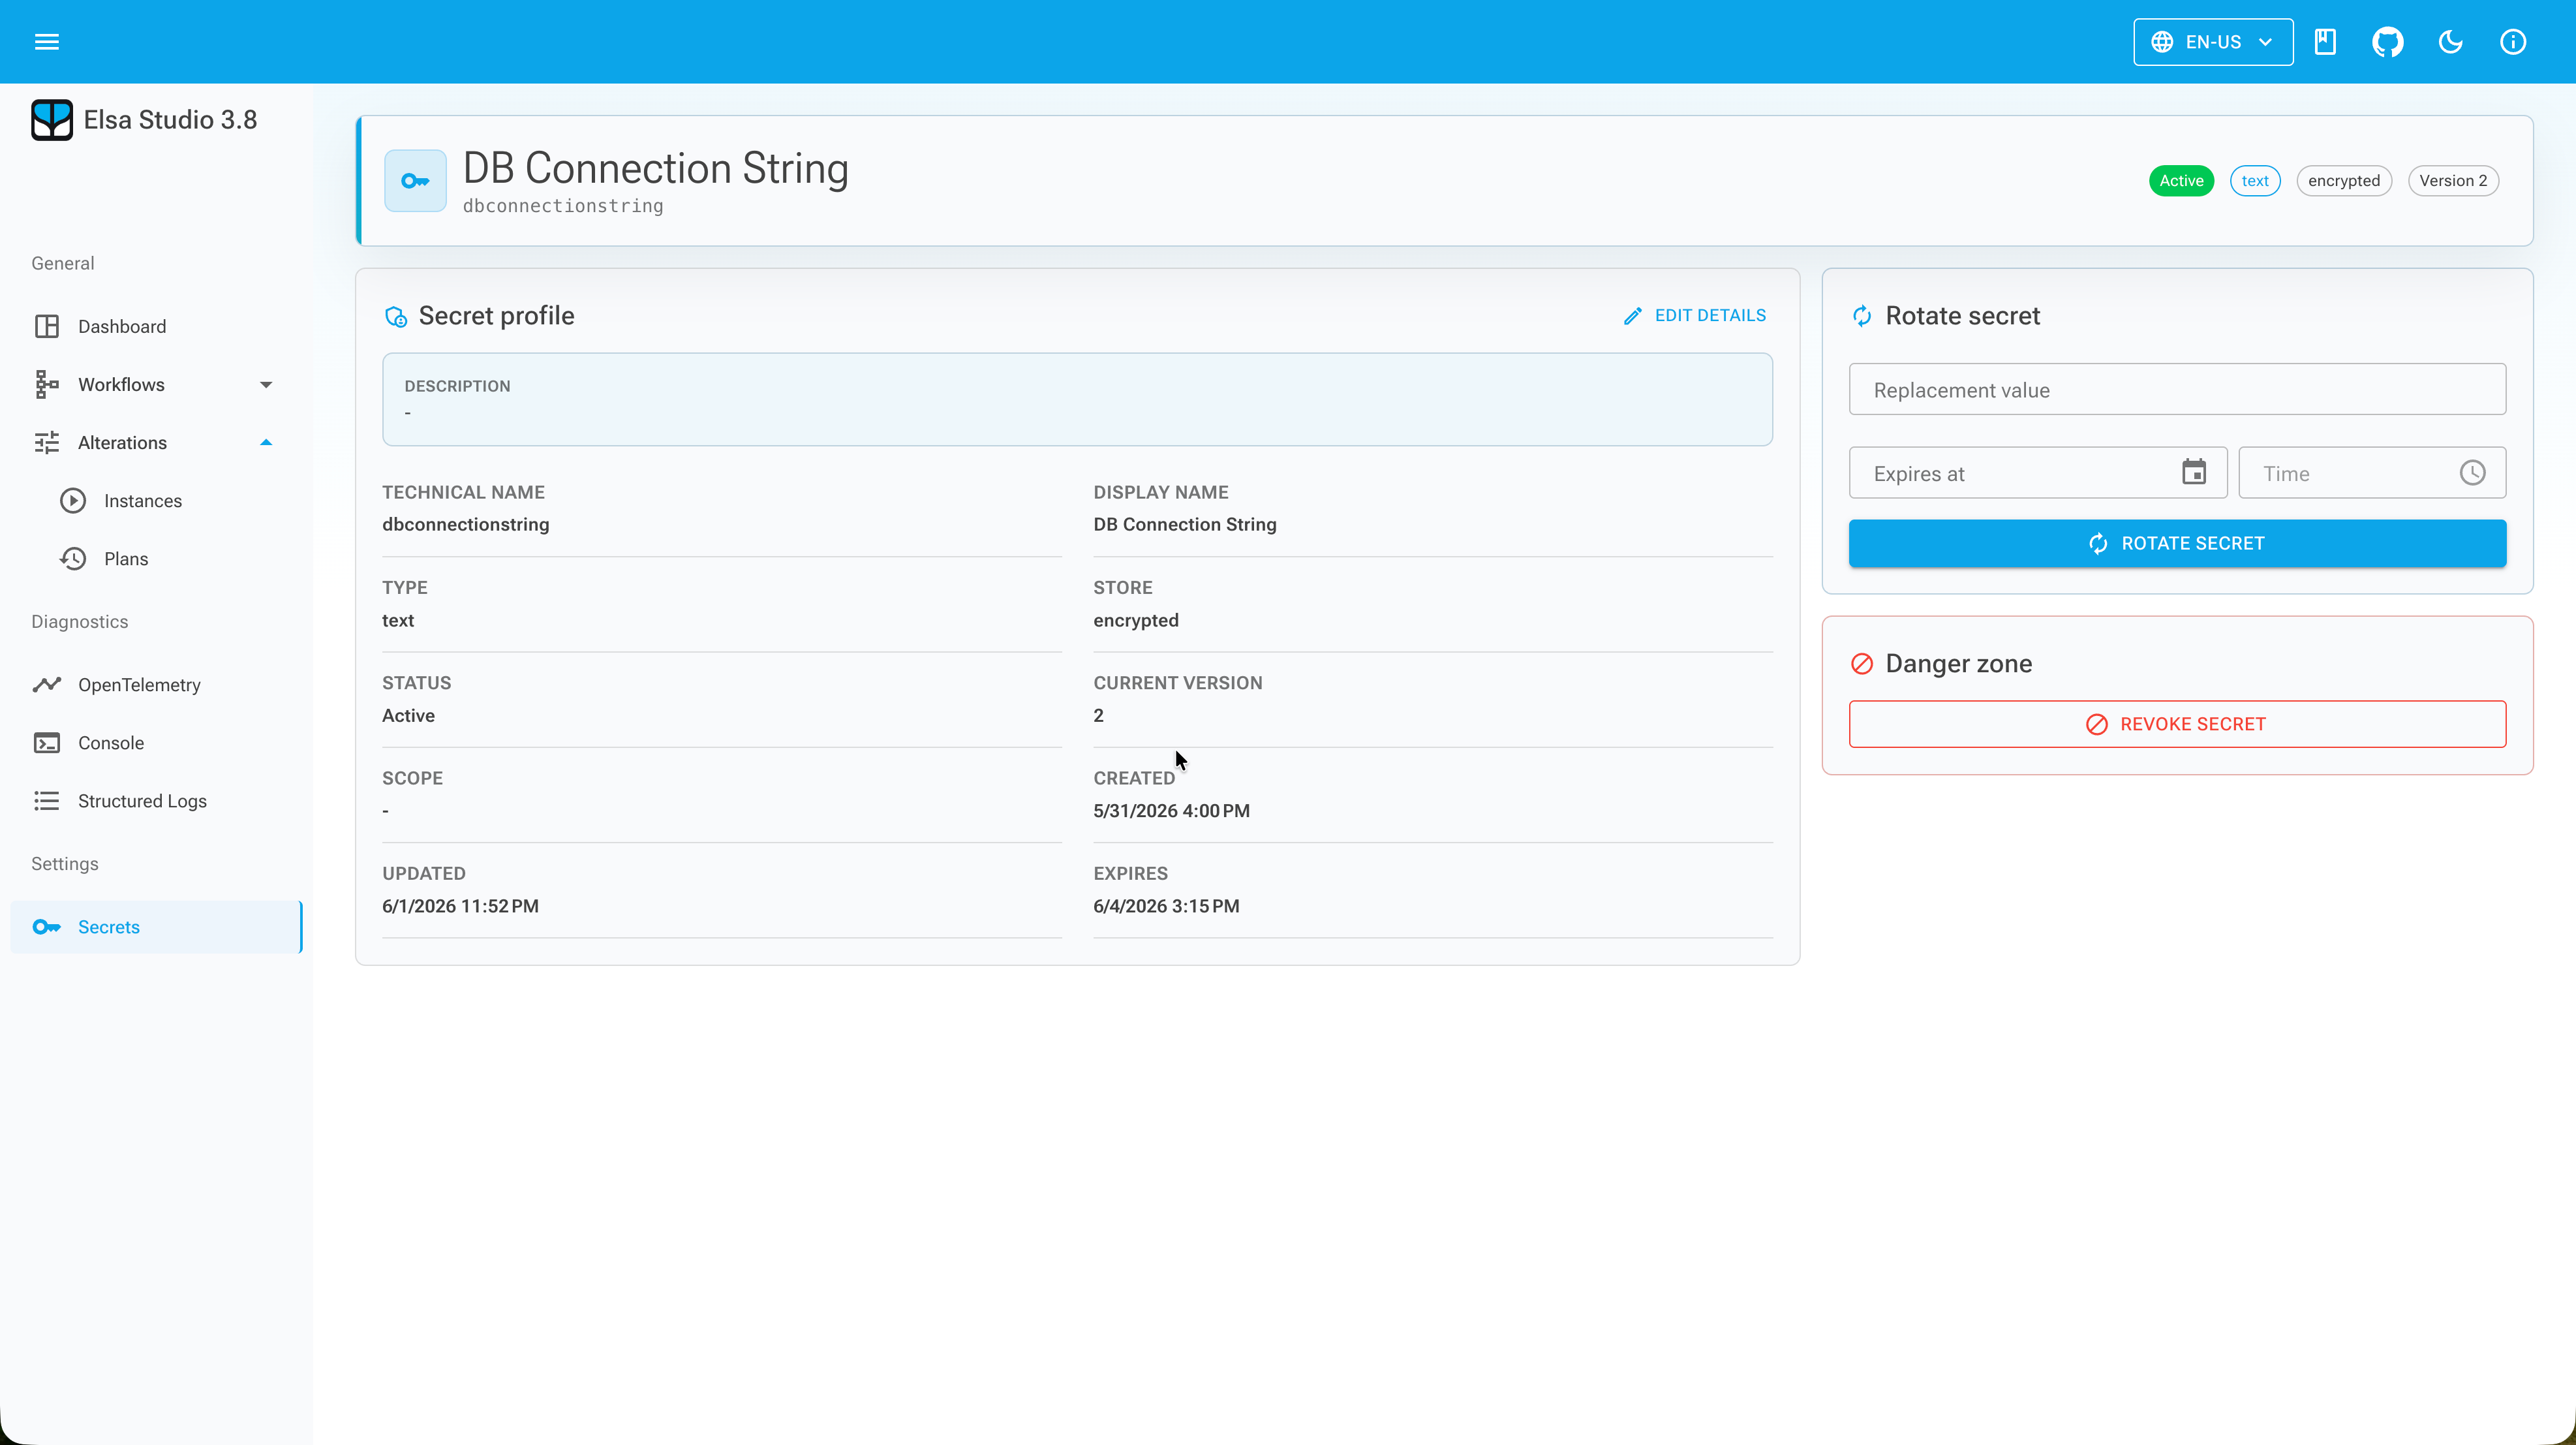
That distinction is the feature. The workflow definition should be able to say "use the production API key" without storing the production API key as normal workflow data.
This is still preview work. I would treat it as the foundation for richer enterprise secret-store integrations and policy controls, not as the final word on every secrets-management scenario.
Why do workflow alterations need a staged UI?
Alterations give Elsa a supported path for changing running workflow instances. The preview exposes dry-run, run, submit, get, and retry endpoints in Core, and Studio adds pages for alteration plans, instance selection, plan details, and an instance edit surface (Workflow Alterations in Elsa 3.8, 2026).
This is a powerful feature, so the user experience matters. A runtime correction should not feel like pressing a random button on a live process.
The built-in alteration catalog covers common operator actions:
- cancel a workflow
- cancel an activity
- schedule an activity
- modify a variable
- migrate an instance to a newer version
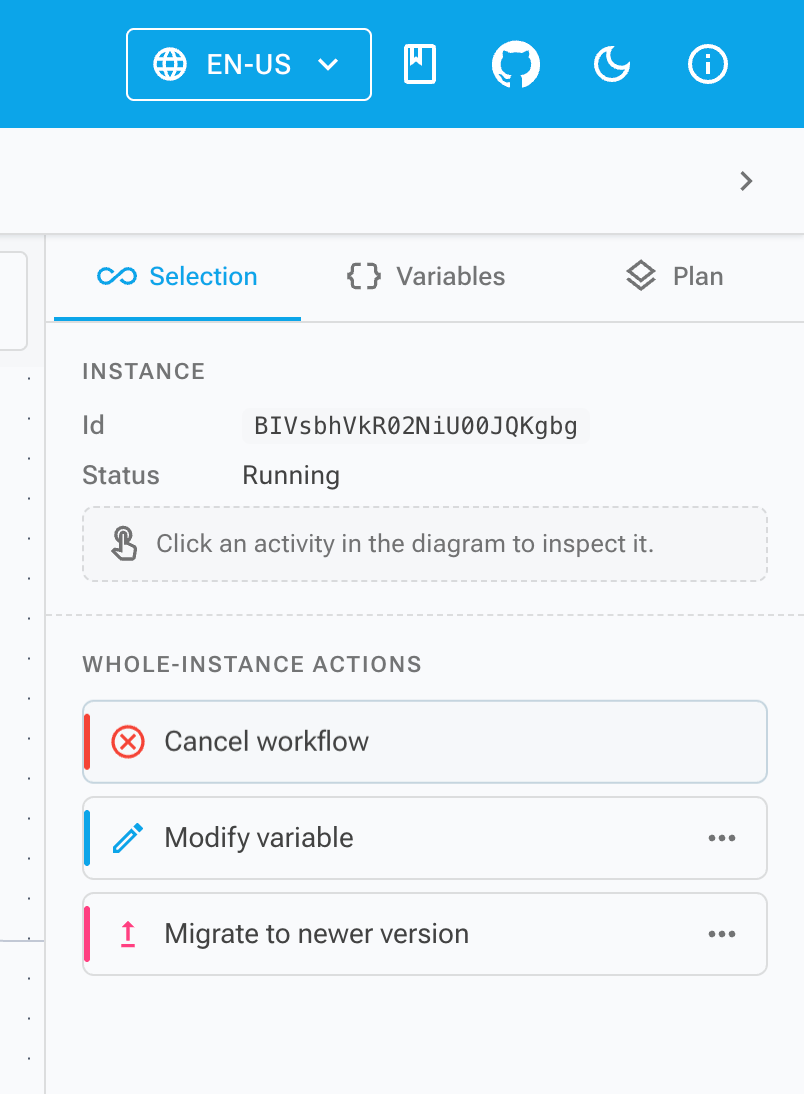
Studio stages those changes before submission. You inspect or select a workflow instance, add intended alterations, configure their fields, review the plan, submit it, and then inspect the resulting jobs, statuses, and log entries.
That staging model is the right constraint. Operators sometimes need to correct a live instance, but the system should still make the change explicit, reviewable, and observable afterwards.
What should teams do with this preview?
Teams should treat Elsa 3.8.0 preview 1 as a preview of the operational model, not just a list of modules. The release adds five related pieces, and all five point toward the same goal: make runtime state visible and make corrective actions explicit (Core release notes, 2026).
For local evaluation, I would start with diagnostics. Enable structured logs and console logs first, then decide whether the OpenTelemetry diagnostics view fits your development or test environment. That gives you immediate feedback without changing how workflows are authored.
Secrets deserve a design pass before broad use. Decide which activity inputs should be secret-capable, which store should own each class of secret, and who can rotate or revoke values. Avoid treating the picker as merely a nicer text box.
Alterations deserve the most caution. Use them for controlled operational correction, not as a substitute for workflow design, retries, compensation, permissions, backups, or incident review. In real systems, a power tool still needs a process around it.
The main direction is clear: Elsa is getting better at being operated. That is the part of this preview I would pay attention to.